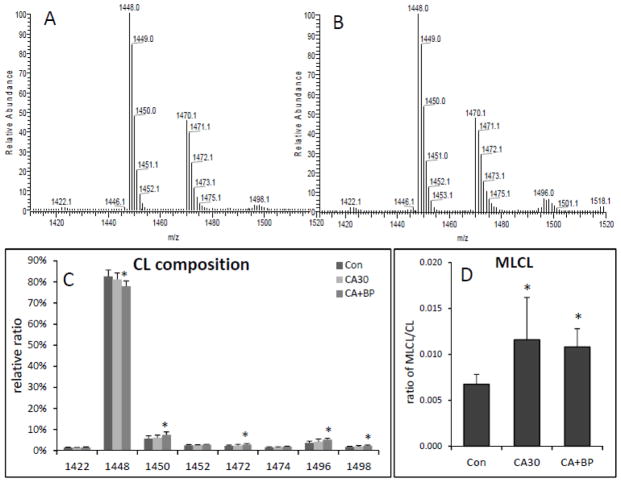
Figure 4.
Change in heart CL composition following 30 min CA and 60 min CPB resuscitation. Representative MS spectra of CL in control (A) and after 30 min CA plus 60 min CPB resuscitation (B). Bar graphs show the relative content of CL molecular species (C) and the relative peak intensity of MLCL as a ratio of CL (D) (n=6; *<0.05, against control).

