
Figure 3. Maspin expression induces prostate cancer cell dedifferentiation in 3D collagen I.
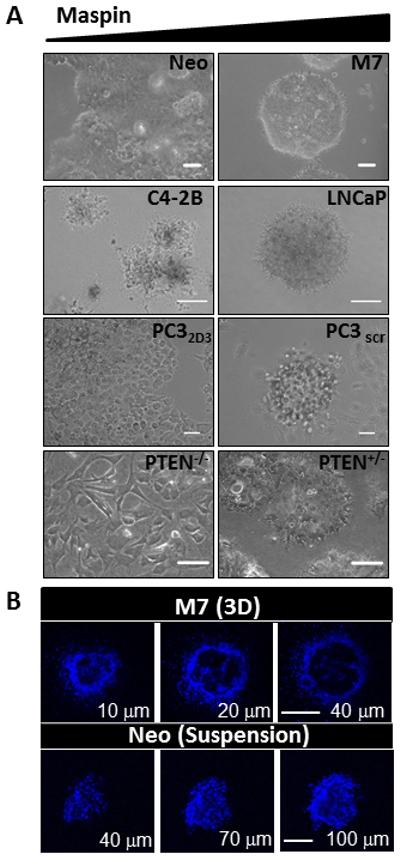
(A) Phase contrast representative fields of isogenic pairs of prostate cancer cells expressing low (left hand panel) and high maspin (right hand panel), embedded in 3D collagen I at days 12-17 (Scale = 50 μm). (B) Confocal fluorescence imaging of the nuclei of M7 cells in 3D collagen I (top, scale = 50 μm) and Neo cells in suspension (bottom, scale = 100 μm) stained with Hoechst dye (blue).