Figure 1.
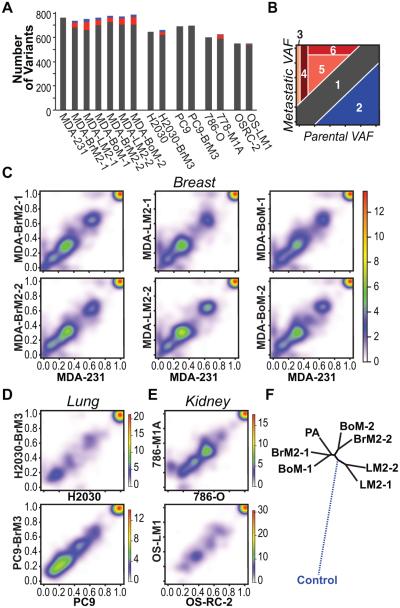
Comparisons of allelic frequencies between parental and metastatic populations reveal selection. A, sequence variations for each sample are quantified. Red bars depict variants found at greater allelic frequencies in metastatic derivatives compared to parental lines. Blue bars depict variants found at lower allelic frequencies. B, categories of observed variant allelic frequency (VAF) shifts. Schematic depicting six categories of VAF shifts. Categories include 1) insignificant changes in VAF; 2) variants depleted in metastatic populations; 3) variants private to metastatic populations; 4) rare parental variants enriched in metastatic populations; 5) parental variants enriched in metastatic populations; 6) parental variants for which the VAF is enriched to 100% in metastatic populations. C-E, pairwise comparisons of VAF between parental and matched metastatic derivative lines in the MDA-MB-231 model system (C), the H2030 and PC9 model systems (D), and the 786-O and OS-RC model systems (E). Key for heatmap representing the density of data points (VAF for each sequence variation found) is depicted to the right of each set of graphs. F, phylogenetic tree depicting the genetic relationships between the MDA-MB-231 parental line and matched metastatic derivatives. The dashed line to control represents simulated data.

