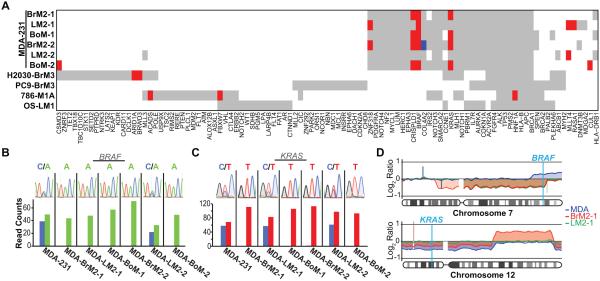
Figure 2.
Selection of oncogenic mutations in metastatic populations. A, graphical representation of sequence variations found in known cancer genes (11, 19, 20). Red bars represent enriched variant alleles (metastatic variant allele frequency ≥ parental variant allele frequency + 0.25, p-value <0.001). Blue bars represent depleted variant alleles (metastatic variant allele frequency ≤ parental variant allele frequency − 0.25, p-value <0.001). B-C, Sanger sequencing (top panels) confirms BRAF (B), and KRAS (C), mutations in metastatic cell populations. Bottom panels show read counts for each allele from whole exome sequencing of each sample. D, copy number analyses of chromosomes 7 (top panel) and 12 (bottom panel). Results from aCGH data were compiled to show comparisons between metastatic derivatives and parental lines.

