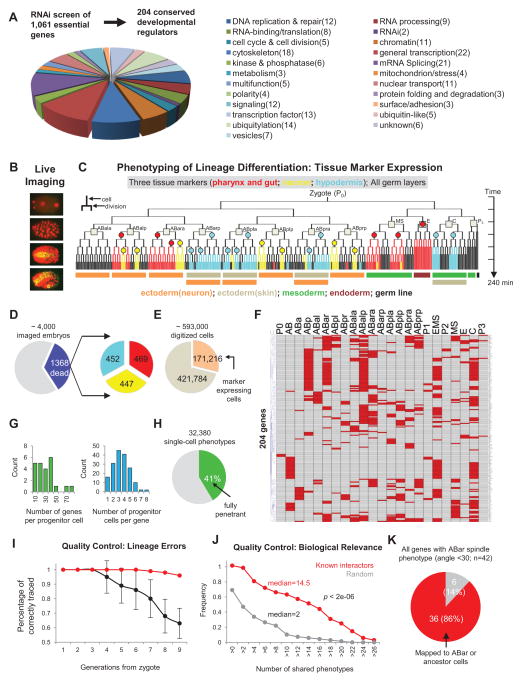
Figure 1. Systematic Perturbation and High-dimensional Phenotypic Analysis of Cell Lineage Differentiation in C. elegans.
(A) Genome-wide RNAi screen and characterization of 1,061 essential genes for embryogenesis identified 204 conserved regulatory genes. Pie chart shows the functional distribution of the 204 selected developmental regulators. See also Figure S1 and Table S1.
(B) 3D time-lapse imaging was used to record the development of RNAi treated embryos.
(C) Phenotypic analysis of lineage differentiation. Lineage differentiation is assessed by analyzing tissue marker expression in the cell lineage. Color-coded tree branches represent the expression pattern of the three markers, with circles representing the clonal expression sites. Squares denote the 12 founder cells and colored bars below the tree indicate the germ layers that different sublineages belong to.
(D) Embryos with the Emb phenotype were used for analysis. Left pie chart shows the frequency of imaged embryos with the Emb phenotype; right pie chart shows the number of analyzed embryos for each tissue marker. Color scheme is as Figure 1C.
(E) Pie chart shows the total number of digitized cells and marker-expressing cells.
(F) Heatmap shows progenitor cell fate changes induced by gene knockdown. Each row shows the progenitor cell fate changes (red) induced by a gene knockdown with names of progenitor cells indicated above. See also Figure S2 and Table S2.
(G) Histograms of genes (left) and progenitor cells (right) in 1F.
(H) Penetrance of phenotypes.
(I) Estimated accuracy of lineaging. The fraction of cells that were correctly traced to different cell generations were estimated for uncurated (black, 10 embryos, ~3500 cell tracks) and curated lineages (red, 100 randomly picked cell tracks). See also Figure S2.
(J) Cumulative histogram of the number of shared phenotypes between known interactors (n=68) and randomly selected gene pairs (n=68). P-value was calculated by two-tailed Mann-Whitney U Test.
(K) Pie chart showing the accuracy of predicted gene action sites using the ABar spindle rotation phenotype (See Extended Experimental Procedure for details).

