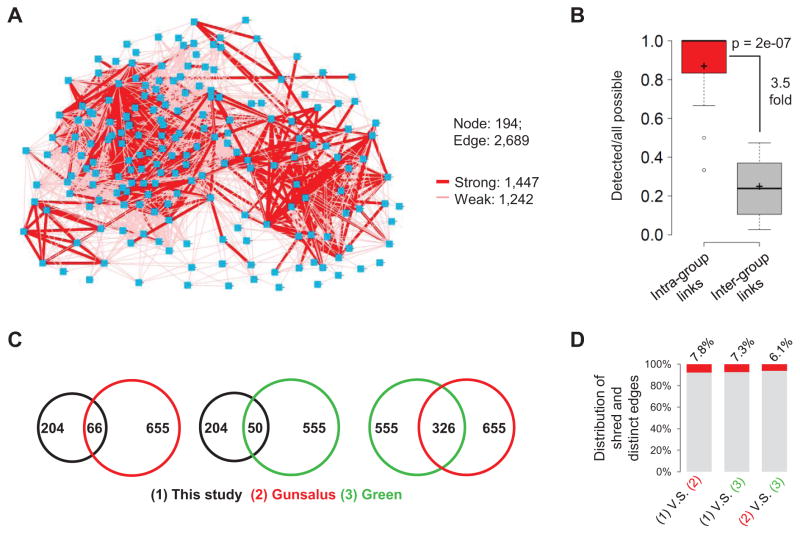
Figure 5. Gene Network Controlling Lineage Differentiation.
(A) Gene regulatory network based on phenotype similarity. Nodes represents genes, edges represent genes that predicted to have similar function. Strong and weak edges are shown in different thickness. See also Figure S4 and Table S4.
(B) Box plot showing phenotypic similarity scores for genes within a protein complex/pathway (red) compared to that of background (gray). Background similarity is calculated as the average similarity between members of a complex/pathway to all other genes. P-value was calculated by two-tailed Mann-Whitney U Test. See also Table S4.
(C) Venn diagrams show the number of shared genes among three studies.
(D) Frequency of shared and distinct edges among three studies. For Green’s network, the automatically clustered network at medium resolution (CSI≥0.95) was used although different resolutions showed similar results.

