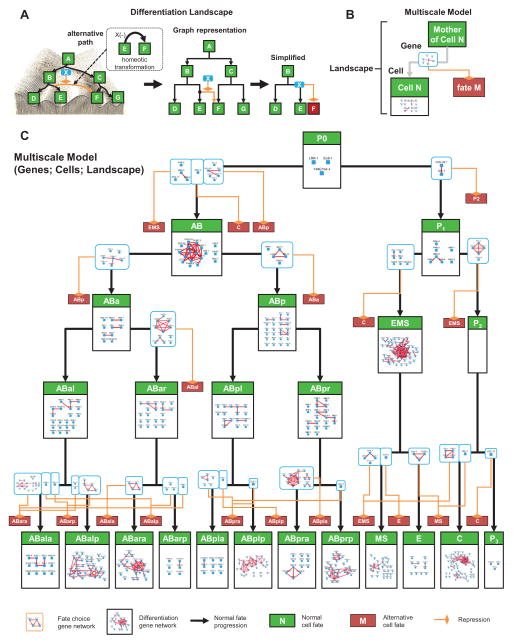
Figure 6. Multiscale Model of Lineage Differentiation.
(A) Depiction of a canalized landscape as a directed graph. Each homeotic transformation (dashed box) is interpreted as an alternative trajectory of fate in a landscape (orange) (left panel). Canalized trajectories of fate progression are depicted as arrows. Genes causing a homeotic transformation are interpreted as repressors of the alternative trajectory (middle panel). To simplify the view, an alternative trajectory is not linked to the major node for the corresponding fate but to a small red node denoting the destination (right panel).
(B) Concept of multiscale model.
(C) Visualization of the multiscale model. Progenitor cell fates (green boxes) are organized based on the wild-type lineage. A gene network repressing each alternative path (light blue boxes) is placed on the corresponding trajectories. Gene networks regulating the execution of cell fate differentiation are placed inside the corresponding fates. See also Figure S5 and Table S5.

