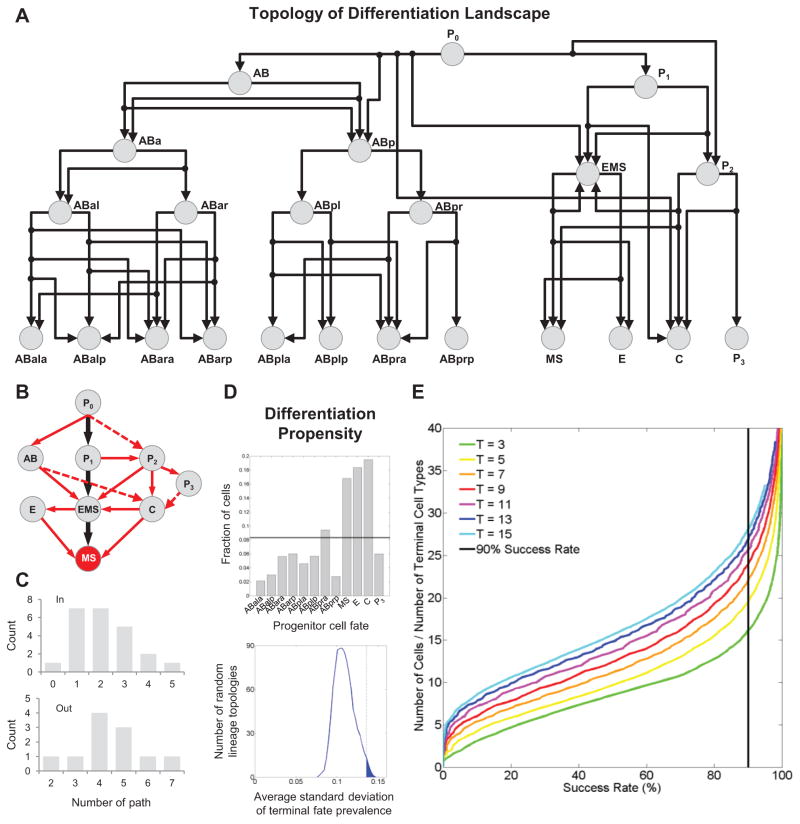
Figure 7. Effect of Landscape Topology.
(A) Directed graph shows the landscape contained in the multiscale model in Figure 6.
(B) Fate trajectories leading to the MS fate. Black arrows show the trajectories in normal embryogenesis. Red arrows show the alternative trajectories revealed by homeotic transformations. Solid arrows show the observed trajectories to MS. Dashed ones show possible trajectories by combining phenotypes of multiple genes.
(C) Distribution of the in- and out-degree of the directed graph.
(D) Top: frequency of each terminal cell in (A) being generated by the zygote (P0) following random fate choices (n=1,000) based on the detected landscape (histogram) and randomized landscapes (line, 1,000 randomized landscapes with 1,000 runs each). Bottom: degree of bias among the terminal cells in (A) across random landscapes. Vertical line marks the experimentally mapped landscape.
(E) Curves show the success rate of differentiation in a multicellular system with a given number of cells randomly differentiating into a given number of cell types (n=10,000 for each multicellular system).

