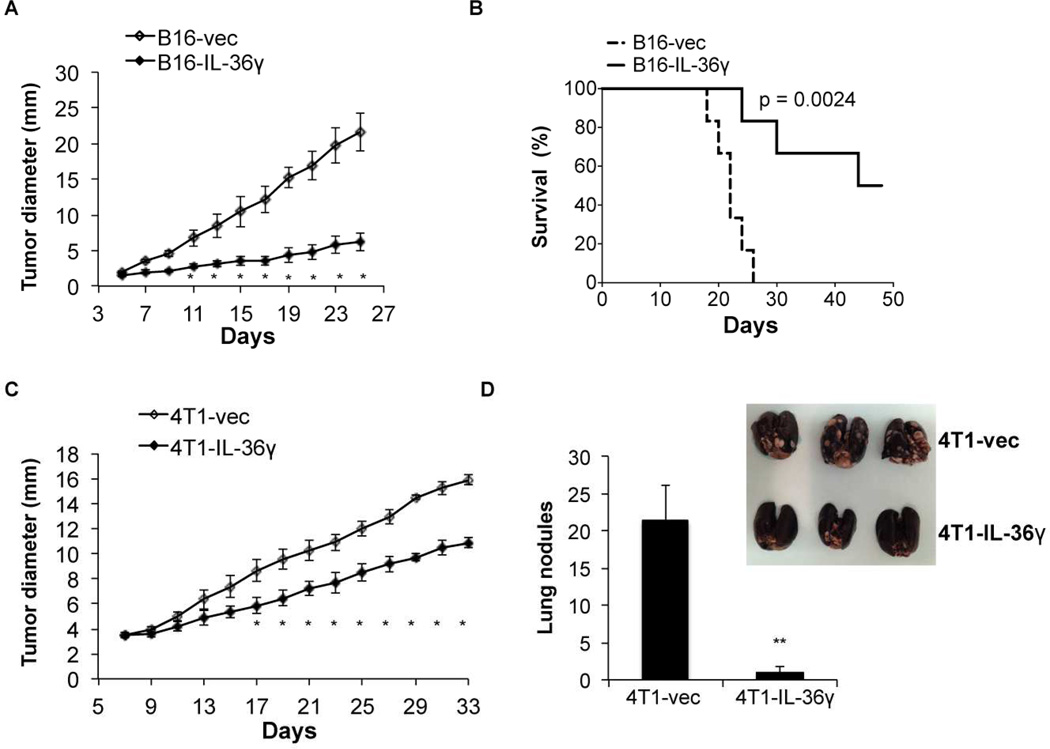
Figure 3. Tumoral expression of IL-36γ resulted in inhibition of tumor progression.
(A) 1×10⁵ B16-vector (B16-vec) or B16-IL-36γ cells were injected intradermally into B6 mice and size of the tumor was monitored every two days. Data (mean ± SEM) are representative of three independent experiments. Five mice were in each group. *p < 0.05, determined by Mann-Whitney Test. Comparison was performed between B16-vec and B16-IL-36γ. (B) Survival of mice was monitored. Six mice were in each group. p value was based on by Log-rank Test. (C) 1×10⁵ B16-vector (B16-vec) or B16-IL-36γ cells were injected intradermally into B6 or IL-36R−/− mice. Survival of mice was monitored. Six mice were in each group. p value by Log-rank Test. (D) 1×10⁵ 4T1-vector or 4T1-IL-36γ cells were injected into the mammary fat pad of BALB/c mice and size of the tumor was monitored every two days. Data (mean ±SEM) are representative of three independent experiments. Five mice were in each group. * p < 0.05, determined by Mann-Whitney Test. (E) Metastatic tumor nodules in the lung were quantified 30 days post 4T1 and 4T1-IL-36γ tumor inoculation. Data (mean ± SEM) are representative of three independent experiments. Five mice were in each group. **p < 0.01, by two-tailed unpaired Student’s t-test. See also Figure S3.

