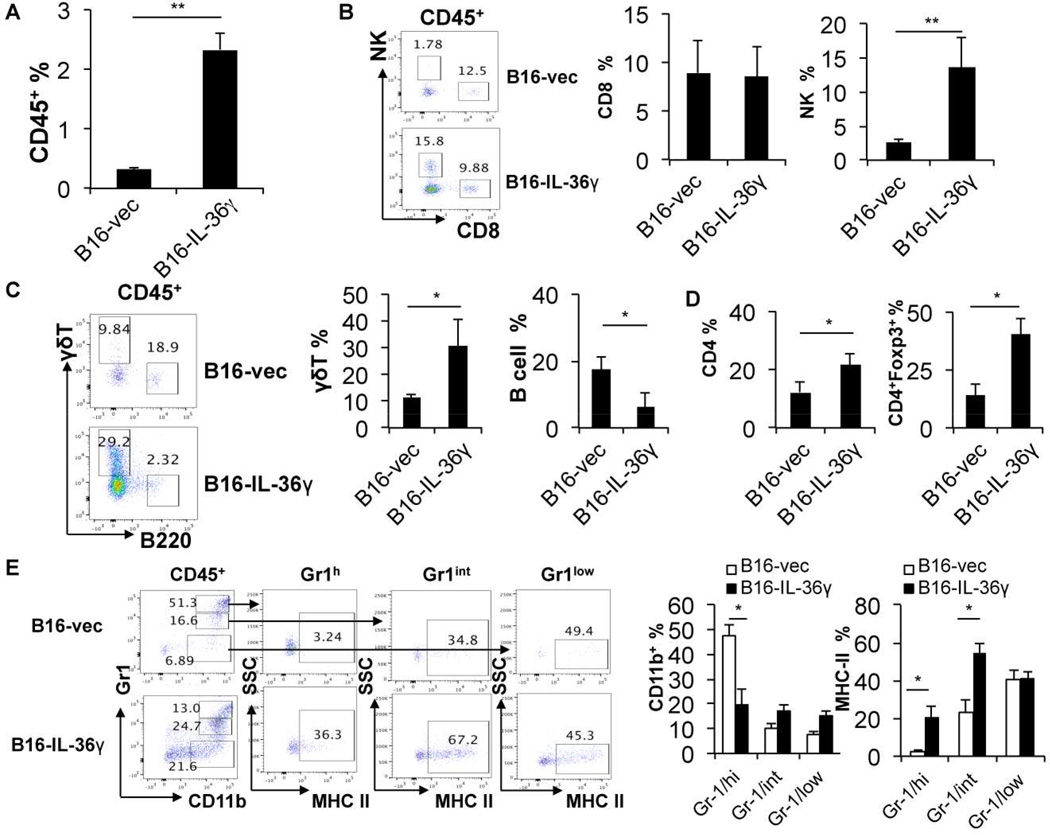
Figure 4. Tumoral expression of IL-36γ shaped the immunogenic tumor microenvironment.
From (A) to (G): 1×10⁵ B16-vector or B16-IL-36γ cells were injected i.d. into B6 mice. On day 24, tumors were resected and processed to generate a single cell suspension. (A) Percentages of CD45+ cells in tumor cell suspension. (B) Representative flow cytometric plots and percentages of CD8+ T or NK1.1+ cells within the gated CD45+ population in tumors. (C) Representative flow cytometric plots and percentages of γδ T or B cells within CD45+ population in the tumor microenvironment. (D) Percentages of the CD4+ T cells within the CD45+ TIL and percentages of CD4+Foxp3+ population within the CD4+ TIL. (E) Representative flow cytometric analysis of CD11b+ sub-populations and percentages of CD11b+ subpopulations of CD45+ immune cells and percentages of MHC class II expression on three CD11b+ sub-populations. Data (mean ± SEM) are average four independent experiments. * p < 0.05 and **p < 0.01 by two-tailed unpaired Student’s t-test. See also Figure S4.

