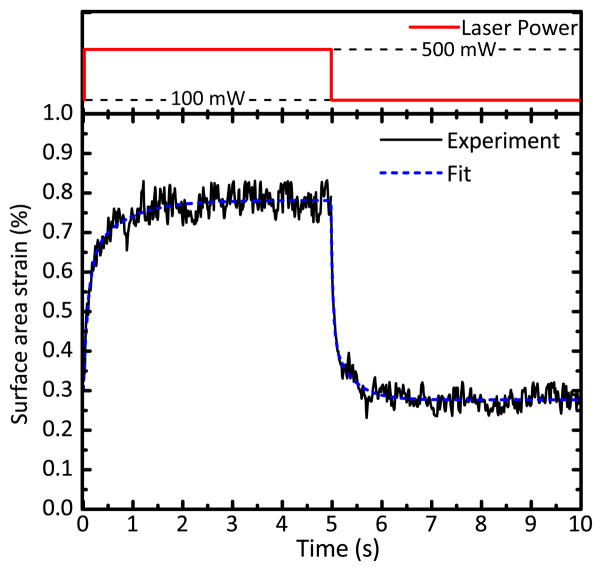
Fig. 2.
(Top) The step increase and step decrease in laser power (red). (Bottom) Time-dependent response and fit to Eq. 1. A single DBOT measurement of one GUV, averaged from 5 stretching events. The fit to this data set for time constants (blue, dashed) yields extracted rise and fall time constants of 0.284 ± 0.011 s (SEM) and 0.163 ± 0.006 s (SEM), respectively.

