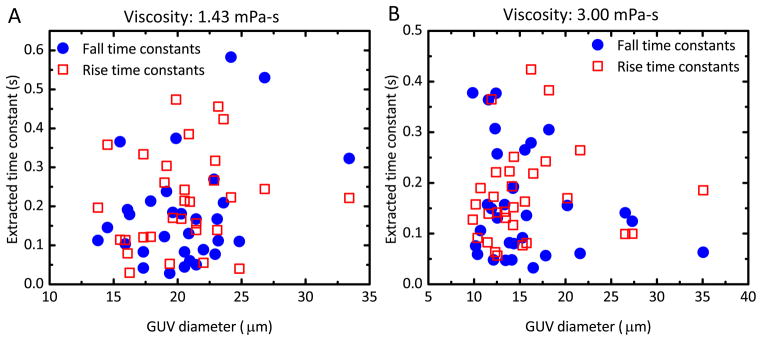
Fig. 4.

Scatter plot of time constant as a function of GUV diameter. (A) The rise (red, squares) and fall (blue, circles) time constants in low-viscosity medium. The linear Pearson’s correlation coefficient is 0.1613 for the rise time and 0.377 for the fall time. (B) The rise (red squares) and fall (blue circles) time constants in high-viscosity medium. Correlation coefficients are 0.0799 for rise time and −0.2177 for fall time.
