
Fig. 1.
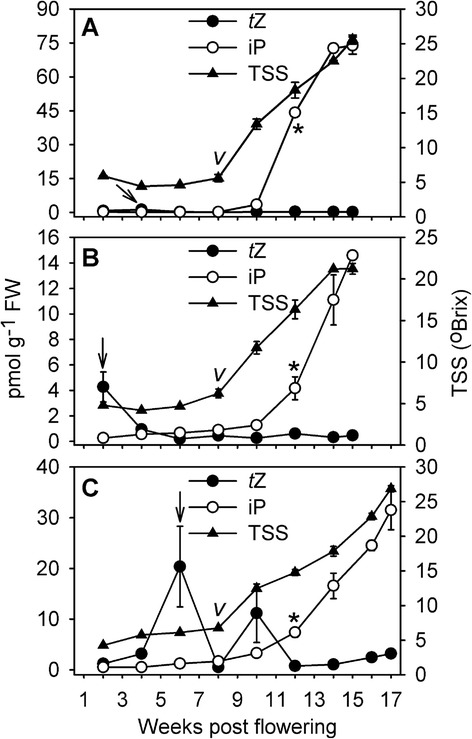
Concentrations of iP and tZ in developing berries from three grapevine cultivars.iP and tZ were quantified by LC-MS/MS in developing berries of field-grown (a) Cabernet Sauvignon, b Riesling and c Pinot Noir. All data represent means (n = 3) ± SE. “v” indicates veraison, as determined by the last time point before a significant increase (p <0.05) in TSS levels was recorded. Asterisks mark the start of a significant increase in iP concentrations. In each cultivar, the concentration of tZ was significantly higher (p <0.05) at one time point compared to the others, and this is denoted by an arrow. FW, fresh weight