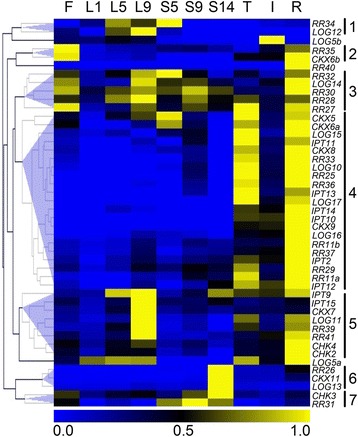
Fig. 3.

Expression profiles of 46 cytokinin-related genes in different Shiraz grapevine tissues. Heat map showing transcript levels of cytokinin-related genes expressed in different tissues of either field grown (flower, seeds, leaves, tendril, internode) or glasshouse grown (root) Shiraz plants as determined by qRT-PCR. In order to adjust for differences in absolute copy numbers between the genes, the mean (n = 3 technical replicates) expression values for each transcript were normalized by dividing by the maximum copy number obtained from the tissue series, making all values fall between 0 and 1. Each column represents a grapevine tissue, each row represents a gene of interest. Hierarchical clustering was used to group genes with similar expression profiles. Copy numbers for all expressed genes are given in Additional files 6 and 7. F, flower; I, internode; L, leaf (node indicated by number, increasing from the shoot apex); R, root; S, seed (wpf indicated by number); T, tendril
