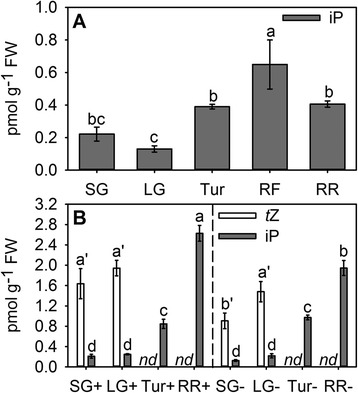
Fig. 4.

Concentrations of iP and tZ in developing tomatoes and strawberries. iP and tZ were analysed by LC-MS/MS in (a) small green (SG), large green (LG), turning (Tur), red firm (RF) and red ripe (RR) tomatoes and in (b) small green (SG), large green (LG), turning (Tur) and red ripe (RR) strawberry receptacles with (+) and without (−) achenes. tZ concentrations were below the limit of quantification in tomato. FW, fresh weight; nd, not detected. Bars represent means ± SE (n = 3) and are denoted by a different letter (a-d, iP; a’-b’, tZ) if the means for each time point differed significantly (p <0.05) using one-way ANOVA followed by Duncan’s post hoc test
