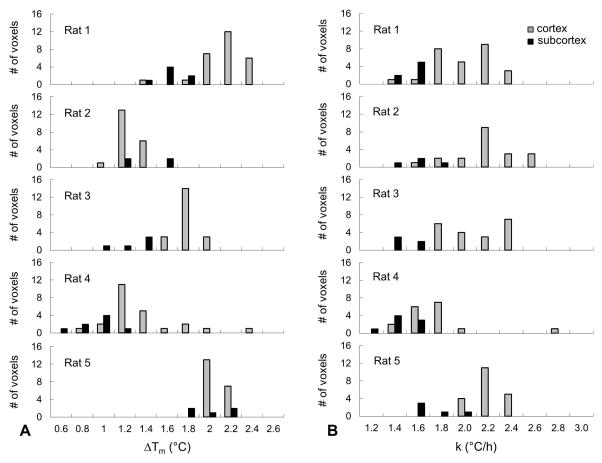
Figure 2. Distributions of MDMA-induced maximum temperature change in relation to warming rate in rat brain measured by TmDOTMA− with BIRDS.
(A) Range of maximum temperature change in cortex (gray bars) and subcortex (black bars) induced by MDMA (ΔTm; see Fig. 1 and eq. 2 for how ΔTm was estimated) in different rats. Although ΔTm was slightly different in each rat, the variance in ΔTm was within a narrow range of 0.4–0.8 °C indicating uniform MDMA-induced changes throughout the brain. The average cortical and subcortical ΔTm measured across all rats (n=5) was 1.6±0.4 °C and 1.3±0.4 °C, respectively. (B) Range of cortical warming rate (k) obtained in different rats (see Fig. 1 and eq. 3 for how k was estimated). Calculated values of k were quite similar in all rats, in the range of 1.4–2.6 °C/h. The average k calculated across all rats (n=5) was 2.0±0.3 °C/h in the cortex and 1.5±0.2 °C/h in subcortex.

