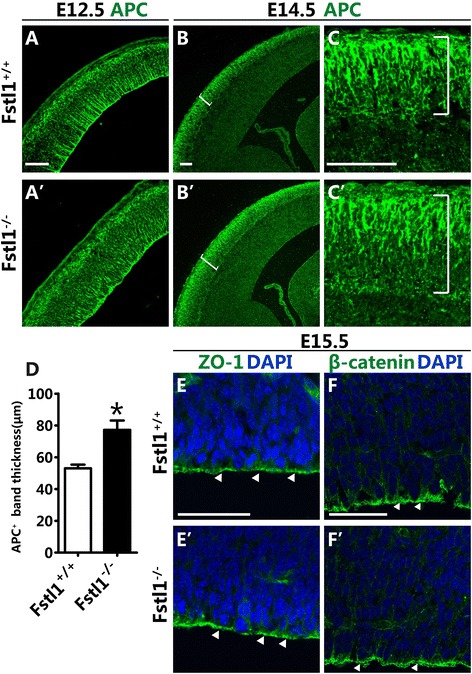
Fig. 7.

The basal rather than the apical polarity of RGCs is altered in Fstl1 −/− mice. a and a’ At E12.5, APC is highly expressed at the pially directed tips of the RGCs and at the apical BM of the VZ. The expression pattern of APC is comparable between the WT (a) and Fstl1 −/− (a’) brains. b to c’ At E14.5, a broader APC-positive band was observed in Fstl1 −/− (b’ and c’) compared to that of the WT (b and c). c and c’ Higher-power views of the boxed areas in b and b’. d The thickness of the APC+ band was reduced in the Fstl1 −/−. Data are presented as the mean ± s.e.m. for the WT (53.06 ± 2.62 μm, n = 3) and Fstl1 −/− (77.20 ± 5.87 μm, n = 3) cortices. *p < 0.05. e to g’ Immunolabelling with anti-ZO-1 (e and e’) and anti-β-catenin (f and f’) at E15.5 showed that the apical polarity of the RGCs was not obviously altered. Scale bars: 100 μm for a-c’, f and f’; 50 μm for e and e’
