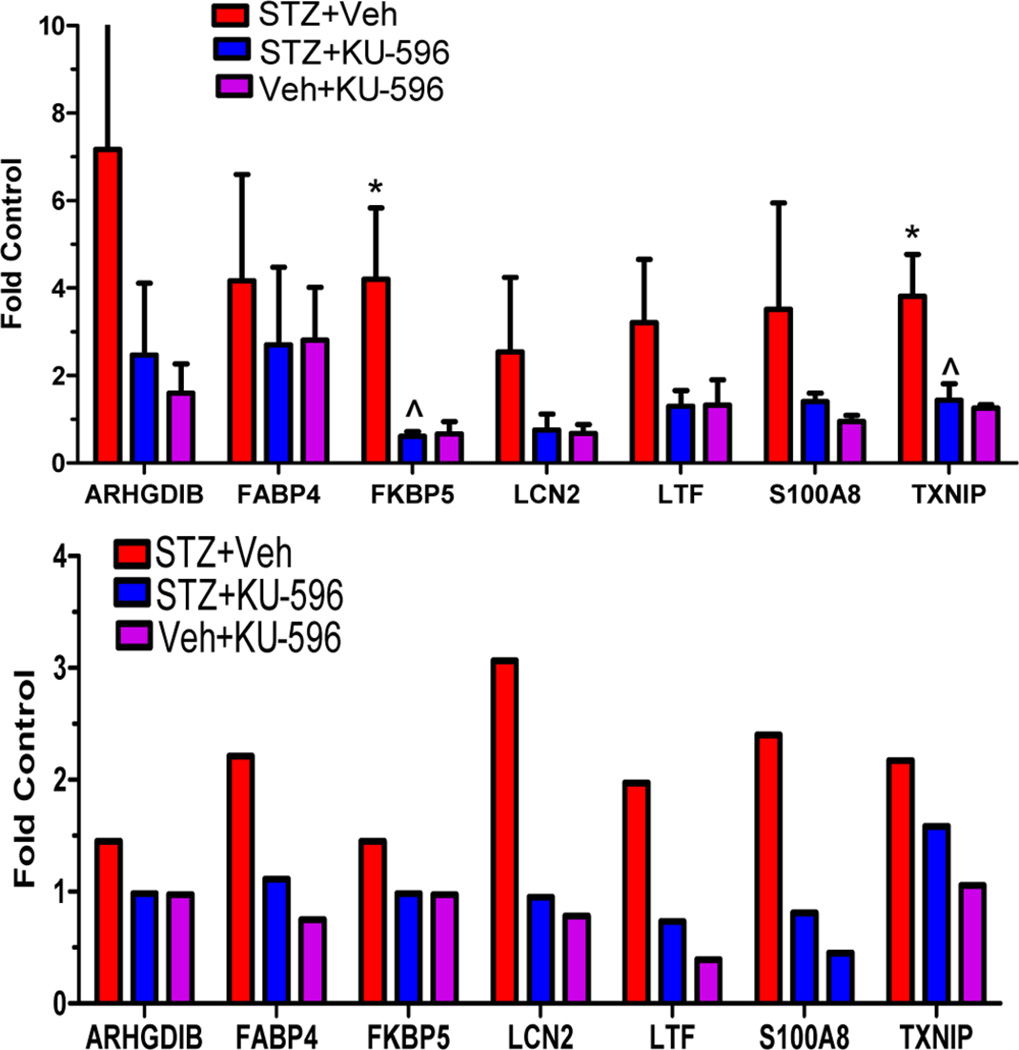
Figure 6.
qRT-PCR validation of RNA-Seq data in C57Bl/6 mice. (A) Total RNA was prepared for mRNA quantification by standard qRT-PCR. Tubulin was used as the internal control. The data were expressed as fold change versus nondiabetic mice for each gene. *p < 0.05 vs Veh + Veh; ^p < 0.05 vs STZ + Veh; n = 3. (B) Fold change versus nondiabetic mice using the normalized FPKM values from RNA-Seq

