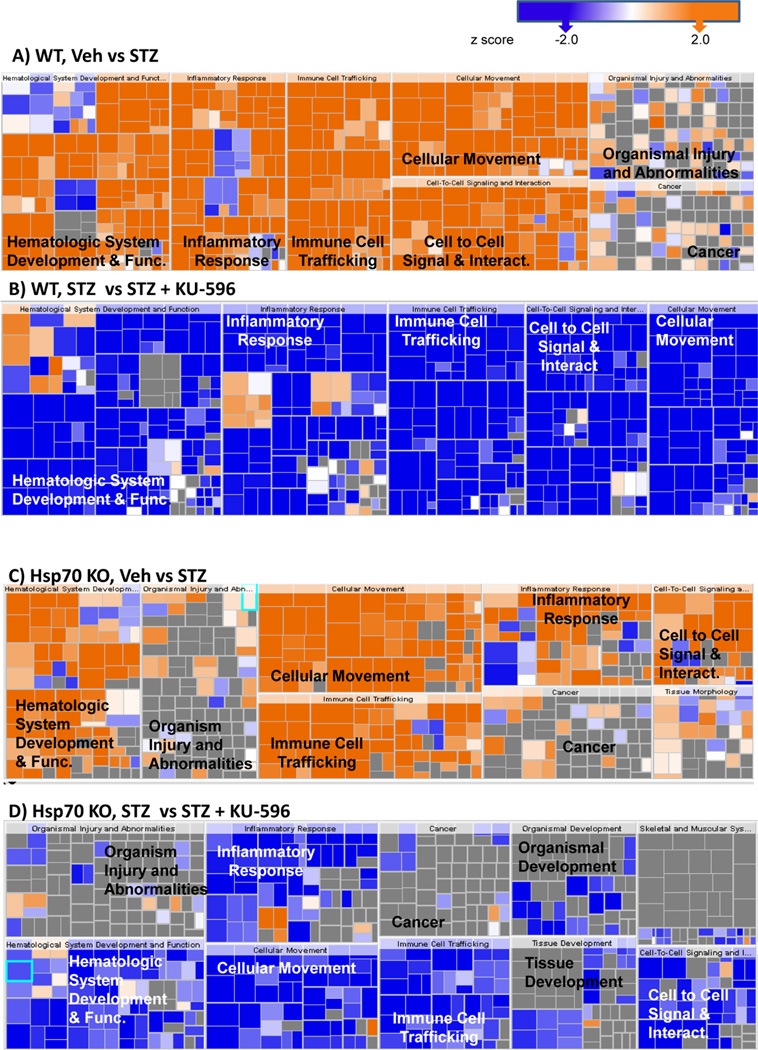
Figure 7.
Significantly altered biologic processes in WT (A, B) and Hsp70 KO mice (C, D). In both genotypes, diabetes activated inflammatory responses (A, C), and these were decreased by novologue treatment (B, D). The size of each box represents the negative log of the p-value of the genes associated with each biologic process, indicating enrichment. The color of each box indicates the activation z-scores; ≥2 (orange, activated) or ≤ −2 (blue, inhibited), gray, no effect.

