Figure 3.
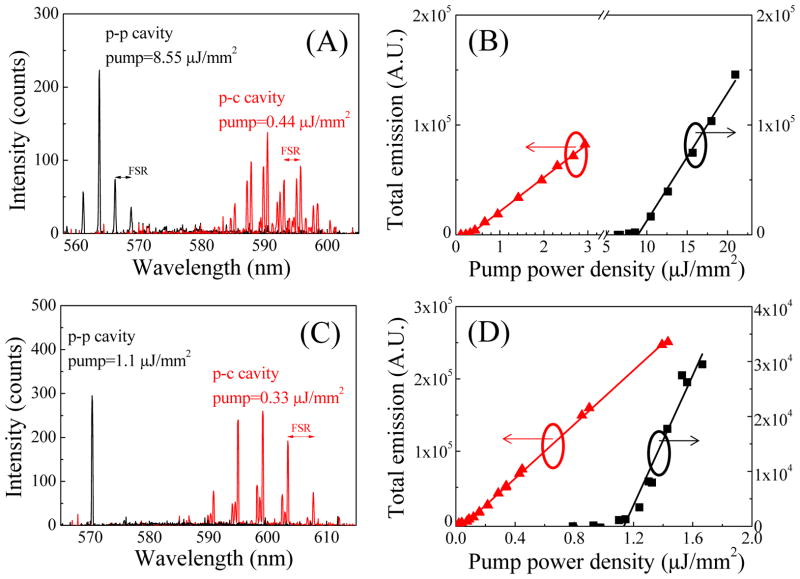
(A) Lasing spectra from 1 mM R6G in ethanol for the p-c and p-p FP cavities on the same Type 1 chip. Free-spectral-range is 2.61 nm and 2.55 nm for the p-c and p-p FP cavities, respectively, corresponding to a cavity length of 49 μm and 46 μm. (B) Spectrally integrated laser emission from 550 nm to 610 nm as a function of pump power intensity corresponding to the p-c and p-p FP cavities in (A). Solid lines are the linear fits, showing a lasing threshold of 0.33 μJ/mm2 and 8.55 μJ/mm2for the p-c and p-p FP cavities, respectively. (C) Lasing spectra from 1 mM R6G in ethanol for p-c and p-p FP cavities on the same Type 2 device. Free-spectral-range was 4.2 nm and 5.3 nm (not shown in the figure) for the p-c and p-p FP cavities, respectively, corresponding to a cavity length of 31 μm and 22 μm. (D) Spectrally integrated laser emission from 550 nm to 624 nm as a function of pump power intensity corresponding to the p-c and p-p FP cavities in (C). Solid lines are the linear fits, showing a lasing threshold of 0.09 μJ/mm2 and 1.1 μJ/mm2 for the p-c and p-p FP cavities, respectively.

