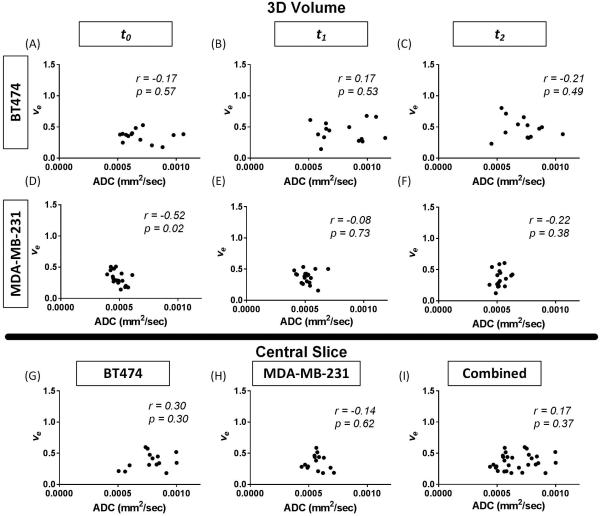
Figure 10.
Correlations between ADC (mm2/sec) and physiologically relevant ve voxels (0.01 ≤ ve ≤ 1) are shown. 3D quantitative analysis correlation of ADC and ve over the whole tumor at baseline (t0), during treatment (t1), and following treatment (t2) in both the BT474 (panels A-C) and MDA-MB-231 (panels D-F) tumor lines. Central slice analysis is shown in the BT474 (G), MDA-MB-231 (H) and combination (I) cell lines. No consistent correlations are seen in these comparisons.

