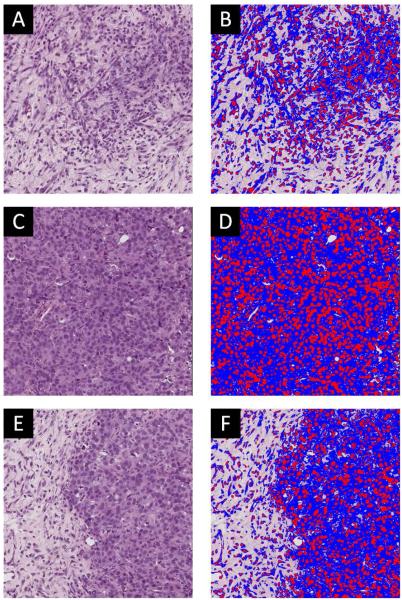
Figure 2.
Panel A presents a H&E stain of a tumor with low cellularity, while panel B shows the color coded segmentation of the tissue into red (positive hemotoxylin staining), blue (eosin counterstaining), and no staining (extracellular regions). Panels C and D display similar data for a tumor with high cellularity, while panels E and F correspond to a more heterogeneous tumor.

