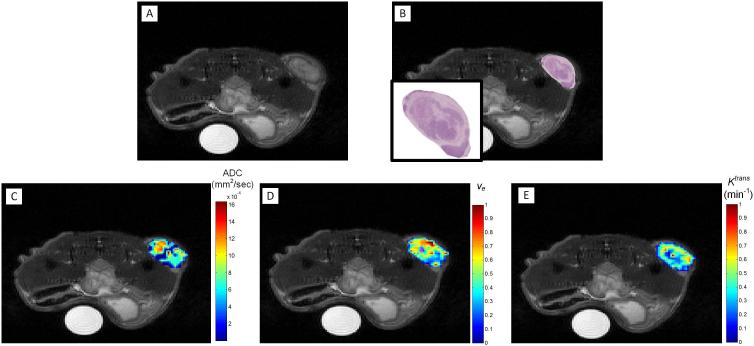
Figure 3.
Representative data displaying a grayscale, T2-weighted anatomical MR image (A), a H&E histological section (with zoomed view in the inset) overlaid on the anatomical image of panel A, and the corresponding ADC (C), ve (D), and Ktrans (E) parametric maps at t2. The ADC map shows higher values (red) in regions where H&E shows lower cellular densities (high extracellular space) as indicated by the lighter pink regions.

