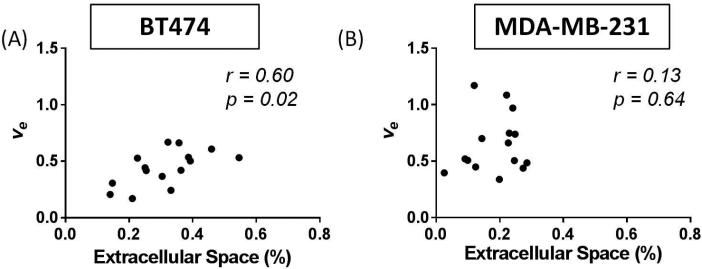
Figure 7.
Analysis of the central slice of the tumor allowed comparisons of histology to DCE-MRI at t2 through the correlation of percent of extracellular space (EC) and ve. The BT474 tumors (A) revealed a significant correlation between these parameters (p = 0.02), while the MDA-MB-231 tumors (B) did not (p = 0.64). This data presents evidence that the standard model of DCE-MRI analysis provides a poor characterization of the extracellular space.

