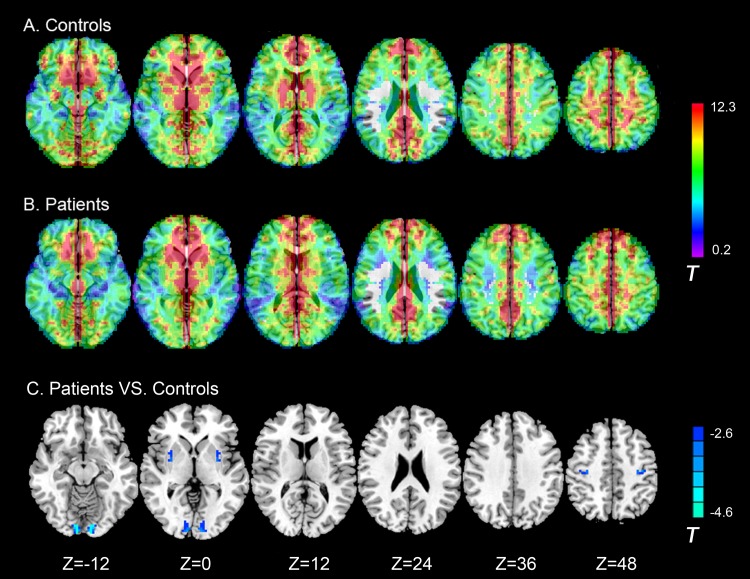
Fig 2. Axial MR images show interhemispheric functional connectivity within and between groups.
Regions show significant interhemispheric functional connectivity in (A) patients with sVCI, and (B) control subjects (p < 0.05, AlphaSim corrected). C, Homotopic regions show decreased (Blue) functional connectivity in patient group (p < 0.05, AlphaSim corrected). Note: The left part of the figure represents the participant’s left side, the right part represents the participant’s right side. sVCI = subcortical vascular cognitive impairment.

