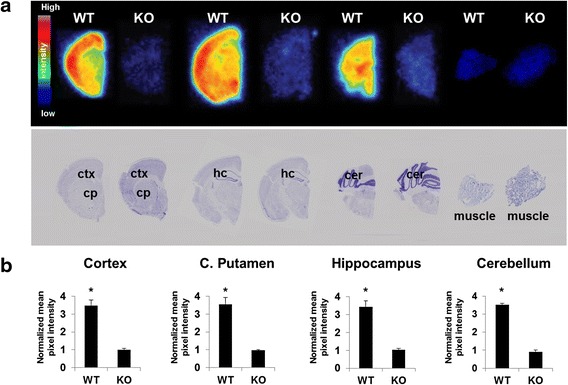
Fig. 4.

Ex vivo autoradiography of S1R-KO and WT mice (25 min P.I.). a Top row contains representative autoradiography images of [18F]FTC-146 from coronal sections throughout the brain of WT & S1R-KO (KO) mice. Second row shows Nissl staining of same sections used for autoradiography (for anatomical comparison). b Mean signal intensity for specific brain regions normalized to muscle for WT and KO mice. We observed three- to fourfold higher uptake of [18F]FTC-146 in all analyzed brain regions for WT mice compared to KO mice (n = 3 WT; n = 4 S1R-KO)
