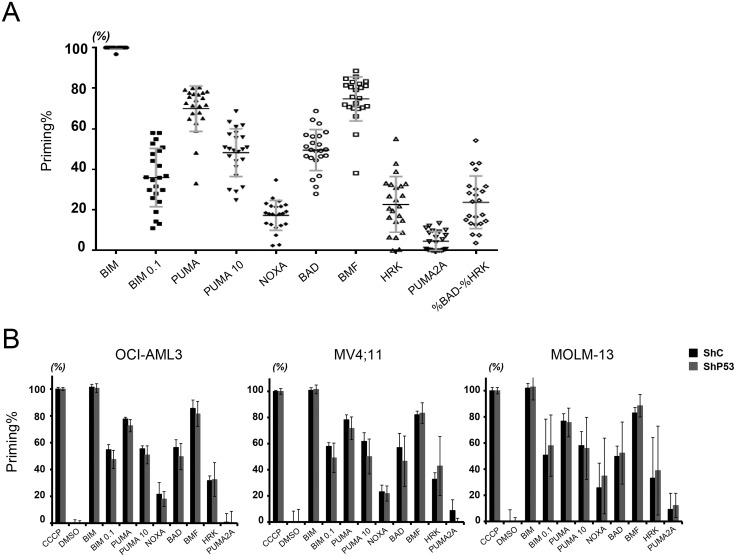
Fig 3. BH3 profiling of AML cell lines.
(A) Distribution of mitochondrial priming to each BH3 peptide in 21 AML cell lines. Cells were exposed to 100 μmol/L BIM, 0.1 μmol/L BIM, 100 μmol/L PUMA, 10 μmol/L PUMA, 100 μmol/L NOXA, 100 μmol/L BAD, 100 μmol/L BMF, 100 μmol/L HRK, or 100 μmol/L PUMA2A at room temperature. Results are expressed as the mean ± standard error of the mean. (B) Comparison of BH3 profiling in p53-intact and -downregulated cell lines. Results are expressed as the mean ± SD. No significant differences in the priming values were observed in any pairs of the isogenic cell lines.

