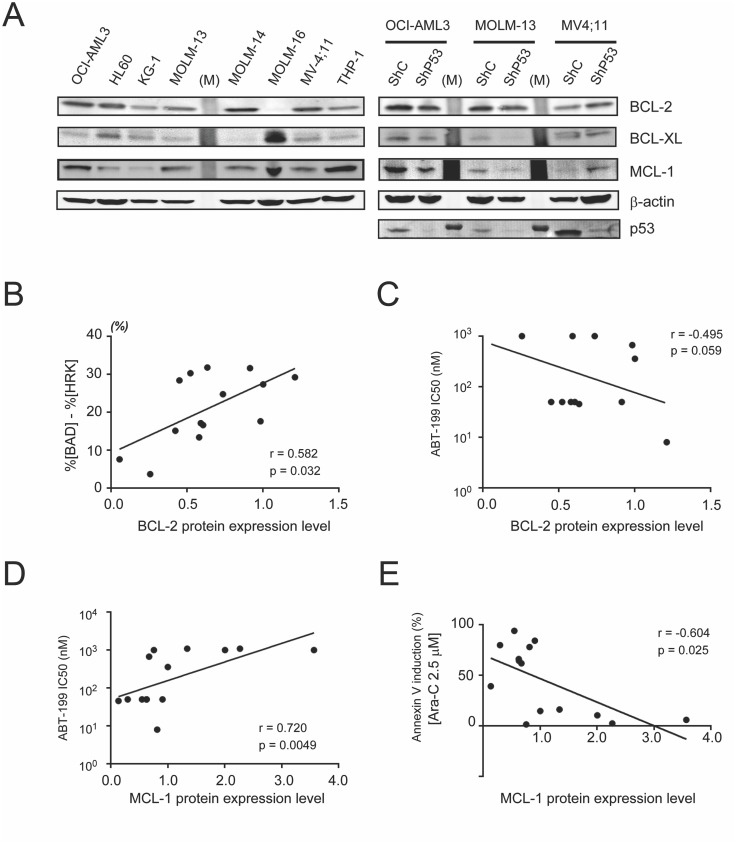
Fig 4. BCL-2, BCL-XL and MCL-1 protein expression, and its correlation with BH3 profiling or cell sensitivity to the study agents in AML cells.
(A) Immunoblotting of BCL-2, BCL-XL and MCL-1 expression in AML cell lines. The lanes for protein ladder markers were represented as (M). (B) Correlation between BCL-2 protein expression and %[BAD]-%[HRK]. (C) Correlation between BCL-2 protein expression and the half-maximal inhibitory concentration (IC50) of ABT-199. (D) Correlation between MCL-1 protein expression and IC50 of ABT-199 in 14 AML cell lines treated with ABT-199 in Figs 1B and 2B. (E) Correlation between MCL-1 protein expression and apoptosis induced by Ara-C (2.5 μM). The values on the x-axes indicate protein expression normalized to the expression of each protein in OCI-AML3 cells. (Protein expression of BCL2 proteins normalized according to expression of beta-actin in each cell line before normalization to OCI-AML3 cells.)

