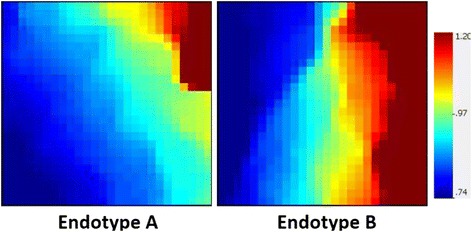
Fig. 2.

Gene Expression Dynamics Inspector–generated mosaics of differentially expressed mitochondrial genes for the two previously defined septic shock endotypes. The 138 gene probes, corresponding to 92 unique genes, are depicted along the same coordinates across the two expression mosaics. Red intensity correlates with increased gene expression, and blue intensity correlates with decreased gene expression. Clear differences in color patterns illustrate differential expression of Nrf2-regulated genes across patient endotypes A and B, with general downregulation in endotype A. Endotype A subjects have higher illness severity, higher mortality, and higher organ failure burden than endotype B subjects
