
Fig. 2.
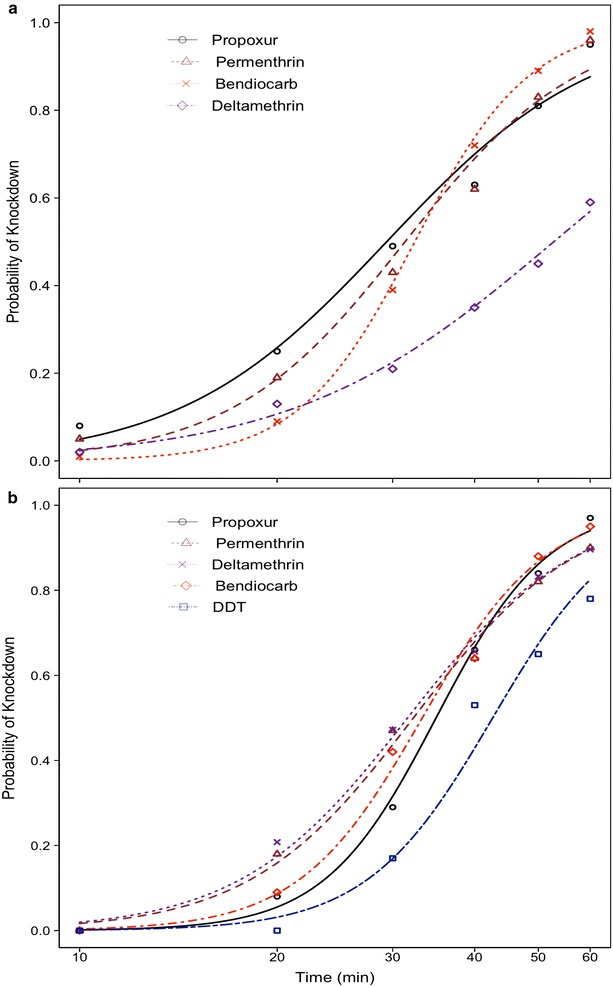
Response curves showing the probability of knockdown of Anopheles funestus a from Balama distric and Anopheles gambiae s.s b from Mocuba district exposed to selected types of insecticides over 60 min exposure-time
Official websites use .gov
A
.gov website belongs to an official
government organization in the United States.
Secure .gov websites use HTTPS
A lock (
) or https:// means you've safely
connected to the .gov website. Share sensitive
information only on official, secure websites.
Response curves showing the probability of knockdown of Anopheles funestus a from Balama distric and Anopheles gambiae s.s b from Mocuba district exposed to selected types of insecticides over 60 min exposure-time