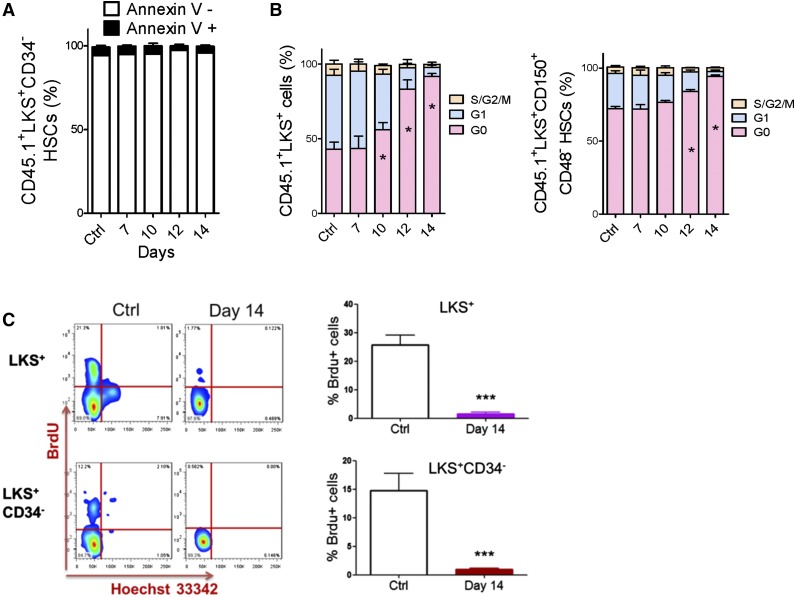
Figure 2.
Apoptosis and cell cycle status of HSCs in leukemic BM. (A) Apoptosis rate of HSCs in leukemic BM. (B) Cell cycle status of HSCs in leukemic BM. (C) Flow plots (left panel) and histogram (right panel) show the BrdU incorporation of HSCs (LKS+ and LKS+CD34−) in leukemic BM. Data are represented as the mean ± SEM (n = 12; 3 independent experiments). Ctrl, control. *P < .05; *** P < .001.

