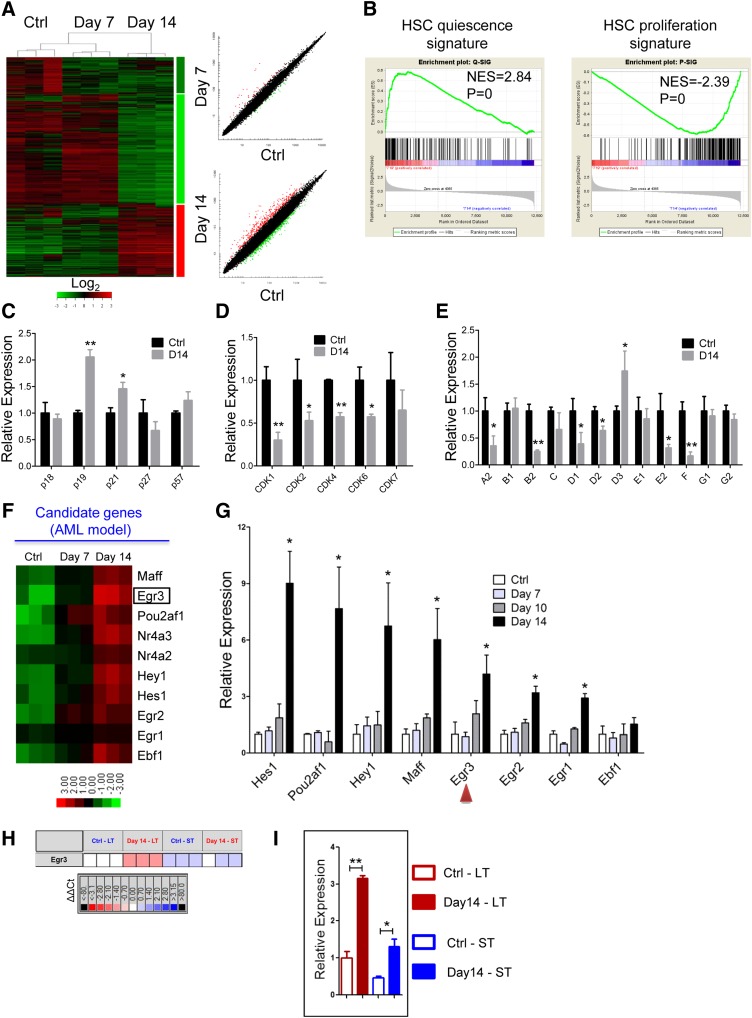
Figure 5.
Differential gene expression of HSCs from the leukemic and control mice. (A) Heatmap (left panel) and scatter-plot representation (right panel) of differential gene expression in normal LKS+ cells at different stages of leukemia. The color scale indicates normalized expression values. (B) Gene set enrichment analysis comparison of LKS+ cells from day 14 leukemia and control mice: the upregulation or downregulation of HSC quiescence-associated gene expression (left panel) and proliferation-associated gene expression (right panel). The normalized enrichment scores (NES) and P values are indicated in each plot. (C-E) The histograms show cell cycle-related gene expression levels in BM LKS+ cells at leukemia day 14 compared with the control. CKIs (C), CDKs (D), and cyclins (E). Data are represented as the mean ± SEM (n = 9; 3 independent experiments). (F) Heatmap representation of candidate gene expression in normal LKS+ cells at different stages of AML. The color scale indicates normalized expression values. (G) The qRT-PCR analysis shows the expression levels of candidate genes in normal LKS+ cells at different stages of AML. Data are represented as the mean ± SEM (n = 9; 3 independent experiments). The red arrowheads indicate the 2 genes that we studied further. (H) The quantitative polymerase chain reaction array analysis of Egr3 expression in LT-HSCs (LKS+CD34−) and ST-HSCs (LKS+CD34+) from day 14 leukemia and control mice. Representative heat map of δ-δ Ct (ΔΔCt) values of positive signals. The red and blue colors indicate high and low gene expression, respectively, relative to the reference. Black indicates no detectable signal. (I) Egr3 expression in LT-HSCs and ST-HSCs from day 14 leukemia and control mice (refer to Figure 5H). Data are represented as the mean ± SEM. Ctrl, control. *P < .05; **P < .01.

