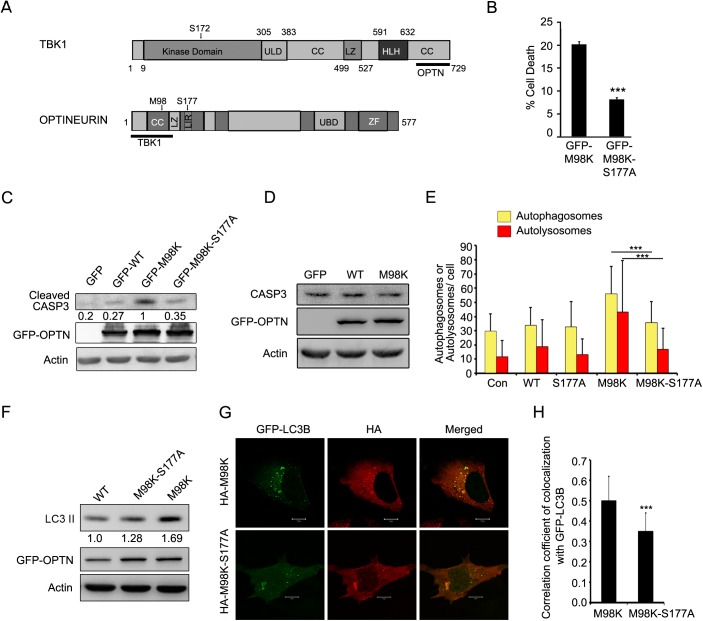
Fig 1. Phosphorylation of OPTN on Ser177 is important for M98K-OPTN-mediated autophagy and cell death.
(A) Domain architecture of TBK1 and OPTN indicating their interacting regions. OPTN-binding site in TBK1 (689-729aa) and TBK1-binding site in OPTN (1-127aa) are shown by a thick bar. CC, coiled-coil; HLH, helix-loop-helix; LIR, LC3-interacting region; LZ, leucine zipper; UBD, ubiquitin-binding domain; ULD, ubiquitin-like domain; ZF, zinc-finger. (B) Quantitation of cell death induced by GFP-M98K-OPTN and its phosphorylation defective-mutant (M98K-S177A-OPTN) in RGC-5 cells upon 32 hrs of expression. Data represent mean ± s.d of percentage of expressing cells showing apoptotic morphology after subtraction of cell death seen in non-expressing cells. n = 6, ***p < 0.001. (C) M98K-S177A-OPTN mutant shows reduced cleavage of caspase 3. Western blots showing cleavage of caspase 3 upon overexpression of GFP, GFP-WT-OPTN, GFP-M98K-OPTN and GFP-M98K-S177A-OPTN mutant in RGC-5 cells. Actin was used as a loading control. The numbers below cleaved caspase 3 blot indicate relative caspase 3 levels after normalization with actin. (D) M98K-OPTN mutant did not change expression of caspase 3. Western blots showing caspase 3 upon overexpression of GFP, GFP-WT-OPTN and GFP-M98K-OPTN mutant in RGC-5 cells. Actin was used as a loading control. (E) Phosphorylation of M98K-OPTN at Ser177 is required for autophagy induction. Quantitation of number of autophagosomes (yellow dots) and autolysosomes (red dots) per cell in control (con), HA-OPTN (WT), HA-S177A-OPTN, HA-M98K-OPTN or HA-M98K-S177A-OPTN transfected cells. n = 35 cells, ***p< 0.001. (F) M98K-S177A-OPTN mutant shows reduced LC3II levels. Western blots showing LC3II levels upon overexpression of GFP-WT-OPTN, GFP-M98K-S177A-OPTN and GFP-M98K-OPTN mutants in RGC-5 cells. Actin was used as a loading control. The numbers below LC3II blot indicate relative LC3II levels after normalization with actin. (G) Representative confocal images of RGC-5 cells expressing GFP-LC3B along with HA-M98K or HA-M98K-S177A. (H) The graph shows Pearson’s correlation coefficient of colocalization of LC-3B with M98K or M98K-S177A. n = 25 cells, ***p< 0.001.

