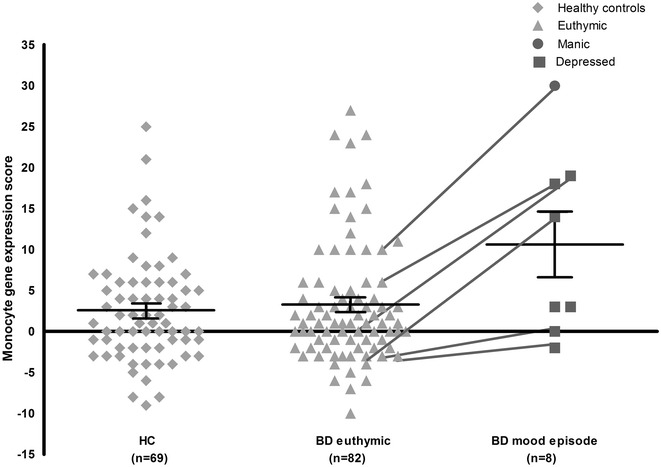
Fig. 1.

Total monocyte gene expression score of healthy controls, euthymic and mood episode BD patients (N = 159). HC healthy controls, BD bipolar disorder. Black lines represent mean and standard error of the mean per group. Lines connecting values from the BD-Eu and BD-Ep group represent the euthymic patients who were measured again when they had a mood episode
