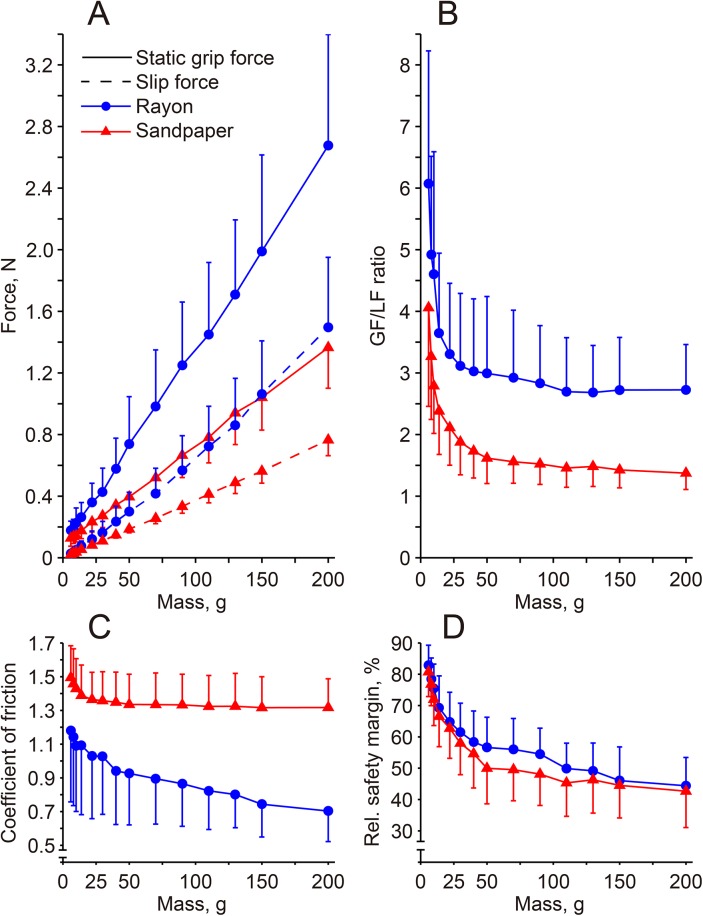
Fig 3. Changes in the static grip force and slip force (A), grip-to-load force (GF/LF) ratio (B), coefficient of friction (C), and relative safety margin (D) in relation to object mass for each surface condition.
The data represent the mean and standard deviation (vertical bars) values of 17 subjects.

