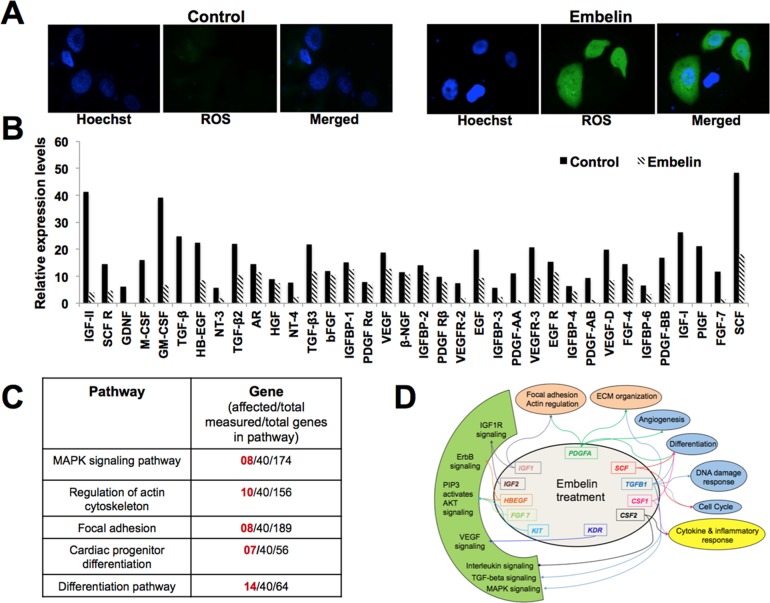
Fig 7. Effect of embelin on ROS level and metastasis regulating proteins.
(A) ROS staining in control and embelin-treated cells is shown. (B) Relative expression levels of secreted proteins in control and embelin (10 μM)-treated breast cancer (MCF7) cells, as obtained by antibody membrane array, depicting decrease in secreted protein levels after embelin treatment. (C) List of pathways regulated by proteins shown in B. (D) Graphical representation of pathways and genes affected by embelin treatment. Proteins shown in the inner circle were downregulated in embelin-treated cells. Pathways regulated by these proteins are indicated in the outer circle. Colored arrows are used to link genes with associated pathways.

