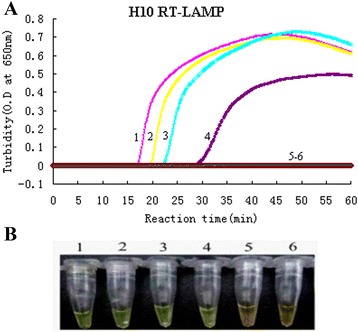
Fig. 2.

Sensitivity results of the H10-RT-LAMP assay. a The turbidity curves of the RT-LAMP products from a 10-fold dilution series of RNA. b Visualization of the RT-LAMP products from a 10-fold dilution series of RNA. 1, 104 copies/μL; 2, 103 copies/μL; 3, 102 copies/μL; 4, 10 copies/μL; 5, 1 copy/μL; 6, blank control
