Fig. 3.

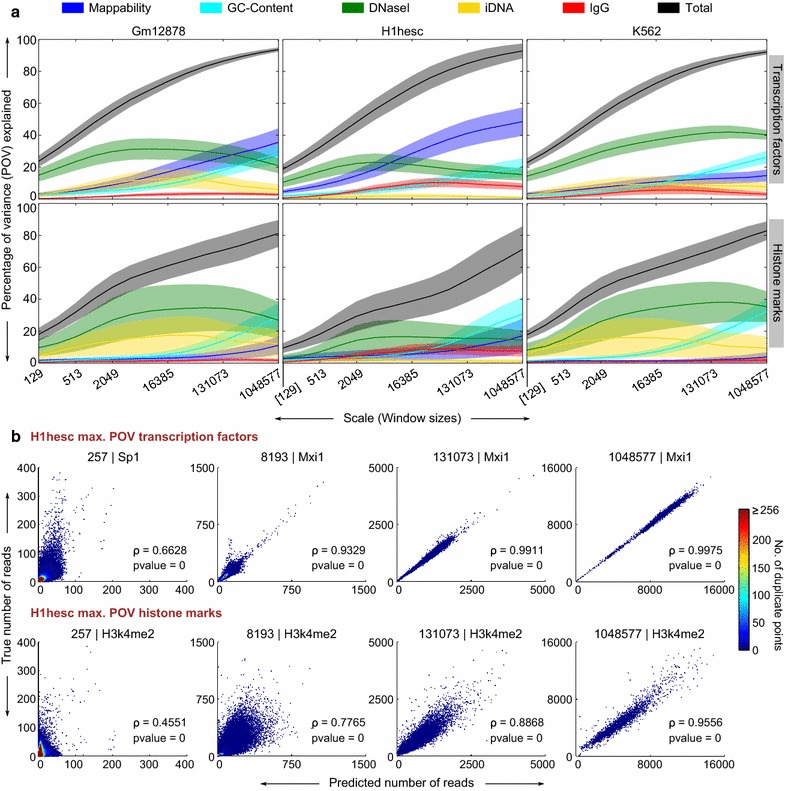
Multiscale analysis of the predictive power of predictors and the overall predictability of ChIP-seq data. a Patch plots showing the variation of predictor power and predictability across multiple scales. For each patch, the dark central line represents the mean across datasets and the surrounding lighter shade represents two standard deviations on either side of the mean. b Scatter plots of the predicted and true read numbers in windows for selected TFs and HMs across multiple scales. For each scale shown, the specific TF and HM are those with the maximum total POV value in the respective group. Similar to the scatter plots in Fig. 2, the predictions have been rounded for consistency with the true read numbers and the points are color coded to indicate duplicate points. The Pearson’s rho (ρ) along with the p-values is also shown
