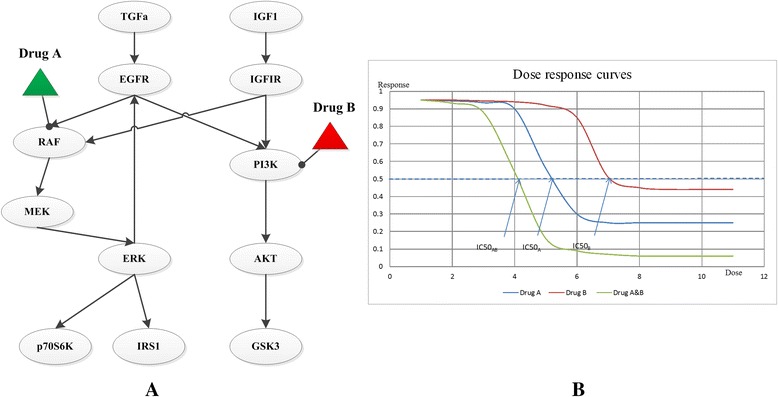
Fig. 2.

An example of pathway simulation model. a. A network-based pathway simulation model of the EGFR signaling pathway. Circles represent different components in a pathway. Triangles are drugs. Edges represent the reactions among different elements of the pathway, and the quantitative dynamic changes for each element can be described by one ODE or other computational models. This pathway network is adapted from Klinger et al. [44]. b. Dose–response plots. The dose–response curves are based on the pathway simulation results for each individual drug (a, b) and the drug combination (ab) respectively, where the half maximal inhibitory concentration (IC50) can be utilized to quantitatively assess drug synergism by dose–response methods like Loewe additivity. If the ratios of two drugs in the combination are both 0.5, an interaction index can be calculated as: , where the denominators represent doses of each drug in the combination that yield a half inhibition effect, while the numerators represent the dose of each drug to produce the same effect when given alone. If this index is larger than one, two drugs are antagonistic, if it is less than one, the combination is synergistic. For the given example, this index is less than one, so drug A and B are synergistic
