
Fig. 1.
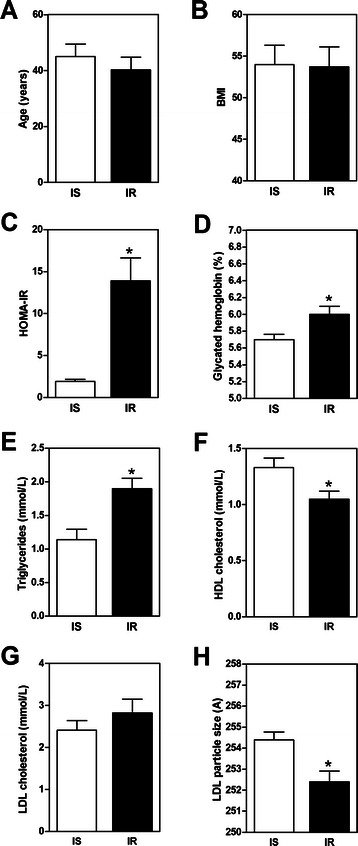
Anthropometric, glucose homeostasis and lipid profile parameters in insulin-sensitive (n = 9) and insulin-resistant subjects (n = 9). Overnight fast values of a age, b BMI, c HOMA-IR index, d glycosylated hemoglobin (%), e) plasma TG (mmol/L), f HDL cholesterol (mmol/L), g LDL cholesterol (mmol/L), and h LDL particle size are shown. Values are mean ± SEM