
Fig. 5.
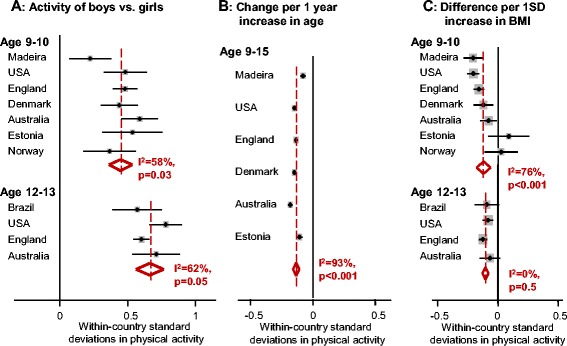
Comparison between selected countries of the relative effect of sex, age and weight status. a Difference in physical activity by sex in selected countries at ages 9–10 and 12–13. b Longitudinal change in physical activity per year of increasing age. c Difference in physical activity associated with higher BMI in selected countries at ages 9–10 and 12–13. SD = standard deviation. Forest plots display random-effects meta-analysis. The estimates for each country were calculated from regression models adjusted for age, sex and season, fitted to each country in turn