
Fig. 1.
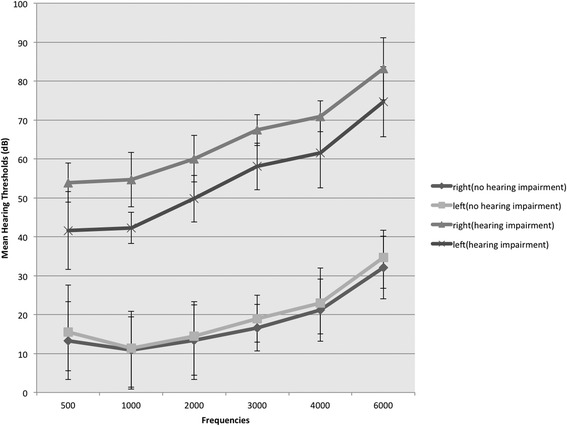
Mean hearing thresholds on both ears in both groups. The hearing thresholds were worse significantly at every frequency in the hearing-impairment group than in the no-hearing-impairment group
Official websites use .gov
A
.gov website belongs to an official
government organization in the United States.
Secure .gov websites use HTTPS
A lock (
) or https:// means you've safely
connected to the .gov website. Share sensitive
information only on official, secure websites.
Mean hearing thresholds on both ears in both groups. The hearing thresholds were worse significantly at every frequency in the hearing-impairment group than in the no-hearing-impairment group