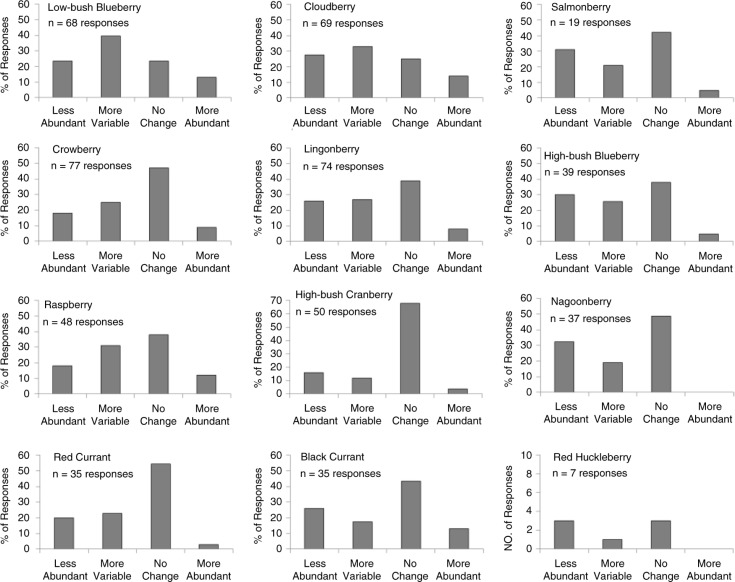
Fig. 5.
Perceived change in abundance for all berries included in the survey, based on the statewide response for that berry. Vertical bars are the percentage of respondents that indicated a change in berry abundance given that the berry occurred near their community. Percentages are not indicated for red huckleberry, due to the small number of respondents for that berry. The number of statewide responses for each berry is indicated.

