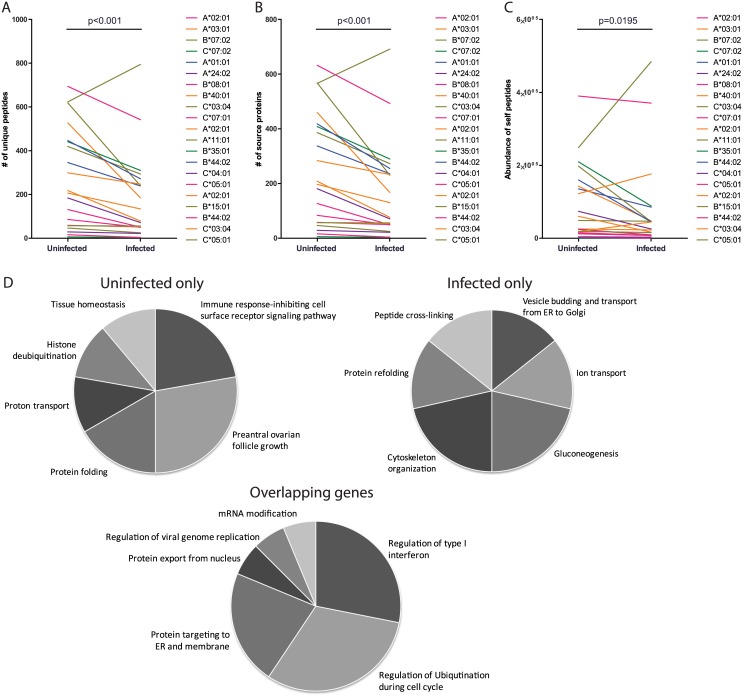
Fig 3. Decrease in host peptides after MV infection.
(A) The number of unique peptides is plotted per infection state. Each line represents one HLA molecule expressed on one BLCL. Similarly, in (B) the number of source proteins per HLA molecule per BLCL is depicted, and in (C) the total abundance of pHLA complexes eluted from the BLCL and predicted to be presented by the depicted HLA molecules. Statistical significance of differences between uninfected and infected data sets (A-C) are analysed using the Wilcoxon matched-pairs signed rank test. The pie charts in (D) show GO analysis results of the top 100 most abundantly presented genes grouped for uninfected cells only (n = 45), infected cells only (n = 45), or both (n = 55).

