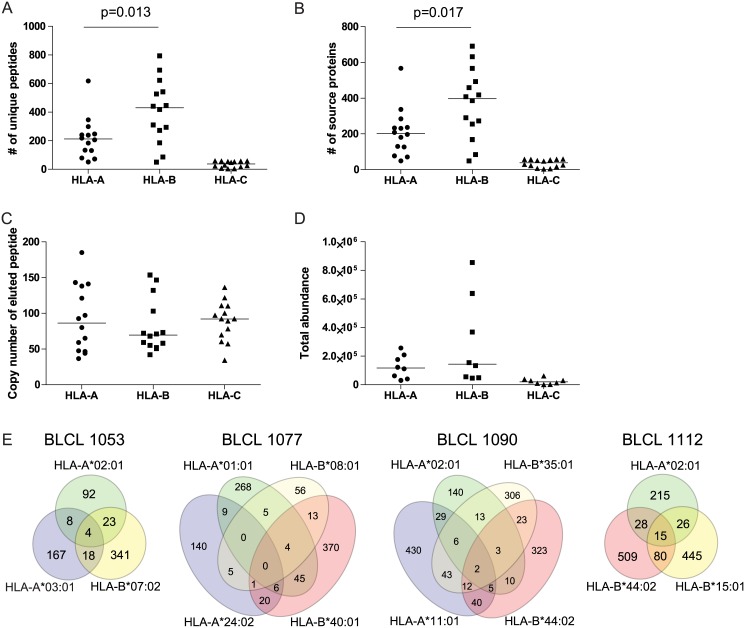
Fig 4. HLA-B molecules present a more diverse self-repertoire than HLA-A molecules.
(A) The number of unique self-peptides eluted from HLA-A, HLA-B or HLA-C molecules. Each dot represents one HLA molecule on one BLCL in one infection state. Similarly, (B) represents the number of source proteins the eluted peptides originate from. In (C) the median copy number of eluted peptides is depicted per HLA molecule per BLCL per infection state. (D) shows the total abundance (sum of copy numbers of all peptides for each HLA molecule per BLCL per infection state). Statistical significance of differences between HLA-A and HLA-B data sets (A-D) was analysed using unpaired t testing and only shown if p<0.05. Venn diagrams in (E) show overlap in source protein usage of the eluted self-peptides per HLA molecule for uninfected BLCL. HLA-A molecules are depicted in green and blue, HLA-B molecules in yellow and red. HLA-C molecules are excluded from the statistical (A-D) and Venn diagram analyses (E).

