Fig. 3.

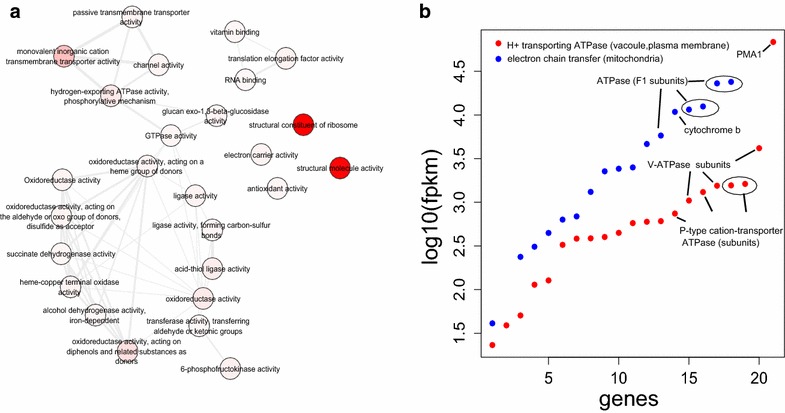
GO enrichment network of the highly expressed genes (enriched category) of the P. anomala strain. The GO graph was obtained from REVIGO [19]. The nodes indicate the enrichment terms and highly similar GO terms are linked by edges. The node color reflects the significance of the GO term (a). A comparison of the log10(FPKM) values and the number of the genes coding proteins involved in the electron transfer chain and H+ transport ATPase (b)
