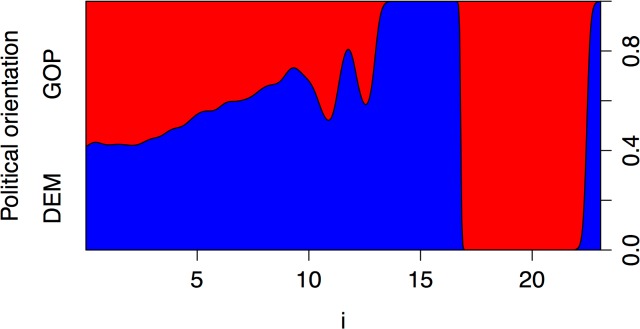
Fig 3. Conditional density plot showing the change in probability of following Republicans vs. Democrats over the frequency of using 1st person singular pronouns.
The plot describes how the conditional distribution of political orientation changes over the use of the first person singular pronoun. For example, when the first person singular pronoun is 15, the probability of the political orientation being DEM is 100%, however, this changes as the first person singular pronoun usage increases.

