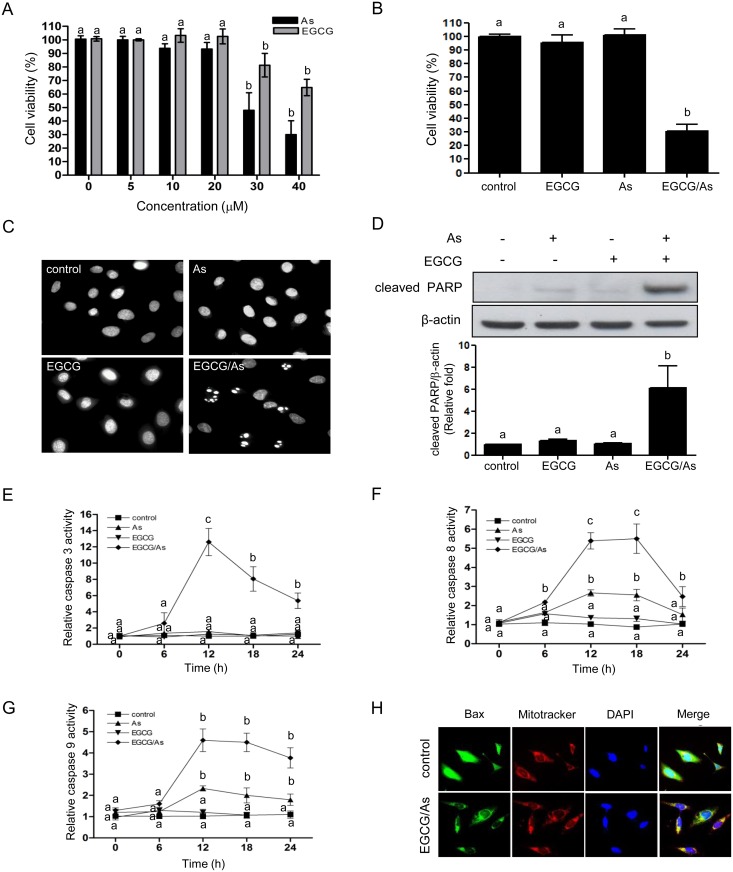
Fig 1. Combined EGCG/As treatment increases apoptosis in BAEC.
(A) BAEC were treated with various doses (0, 5, 10, 20, 30, or 40 μM) of As or EGCG for 24 h. (B) In some experiments, cells were also treated for 24 h with 20 μM EGCG, 20 μM As, or the combination of 20 μM EGCG and As each (EGCG/As). (A, B) Cell viability was measured using MTT assay. (C, D) Cells treated with EGCG, As, or EGCG/As for 12 h. (C) Apoptotic cells were detected by DAPI staining. (D) Cells were lysed in RIPA buffer. An equal amount (20 μg) of each cell lysate was subjected to Western blot analysis. Levels of cleaved PARP expression were detected with an anti-cleaved PARP antibody. Quantifications were performed using densitometry (Image J software) and results were normalized to β-actin. (E-G) The activity of caspases (3, 8, and 9) was measured in cells treated with EGCG, As or EGCG/As for the specified times (0, 6, 12, 18, or 24 h). All line graphs represent the relative caspase activity of the control. (H) Assay for Bax translocation into the mitochondria. Cells treated with EGCG, As, or EGCG/As for 12 h were stained with FITC-conjugated anti-Bax antibody, Mitotracker as a marker of mitochondria, or DAPI. All bar graphs represent the mean ± S.D. of 3 independent experiments. The different characters refer to significant differences (P < 0.05) among groups, which were determined by one-way ANOVA followed by post hoc Student-Newman-Keuls analysis.

