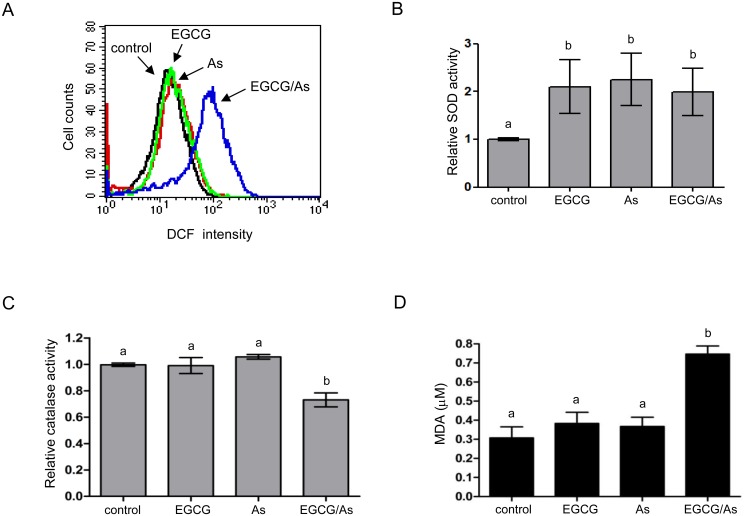
Fig 2. Combined EGCG/As treatment increases ROS generation and decreases the activity of catalase but not SOD.
(A) ROS levels were determined by flow cytometric analysis using DCFH-DA staining. Cells were treated with EGCG, As, or EGCG/As (each 20 μM) for 3 h and then stained with DCFH-DA. Stained cells were analyzed by flow cytometry using Cellquest software. The data are representative of 3 independent experiments. (B) SOD activity was assessed in cells treated with EGCG, As, or EGCG/As (each 20 μM) for 30 min. (C) The catalase activity was measured in EC treated with EGCG, As, or EGCG/As (each 20 μM) for 2.5 h. (D) Lipid peroxidation was estimated by measuring the production of malondialdehyde (MDA) using the Colorimetric Microplate Assay for Lipid Peroxidation Kit (Oxford) according to the manufacturer’s protocol. All bar graphs represent the mean ± S.D. of 3 independent experiments. Statistical analysis was accomplished as described in the legend of Fig 1.

