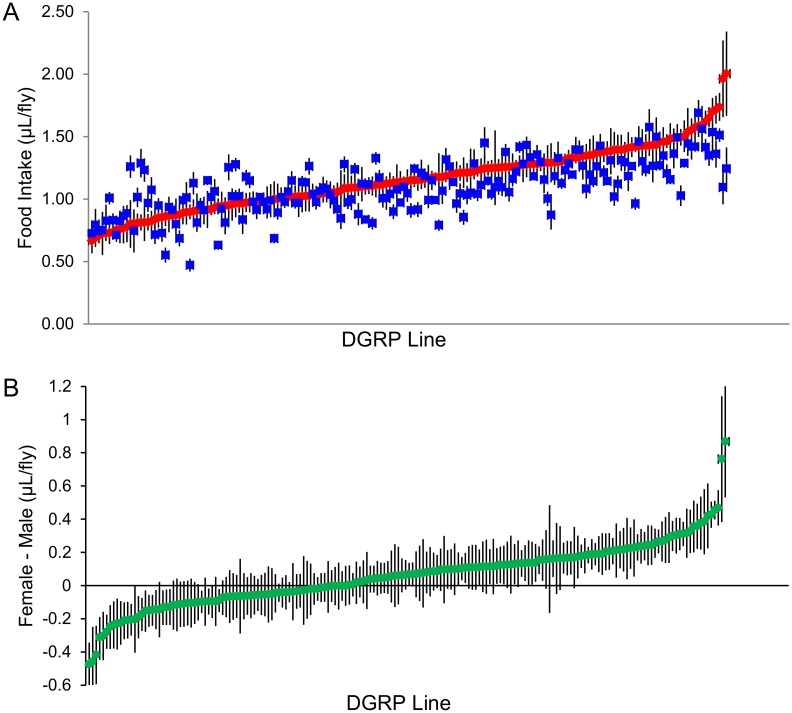
Fig 1. Variation in mean food intake in the DGRP.
(A) Mean food intake in 182 DGRP lines, arranged in order from lowest to highest in females (red diamonds). Mean food intake of males (blue squares) are given in the same order as the female scores. (B) Sexual dimorphism of food intake. The female-male difference in mean food intake of each line is ordered from lowest to highest. All error bars are ± SE.

